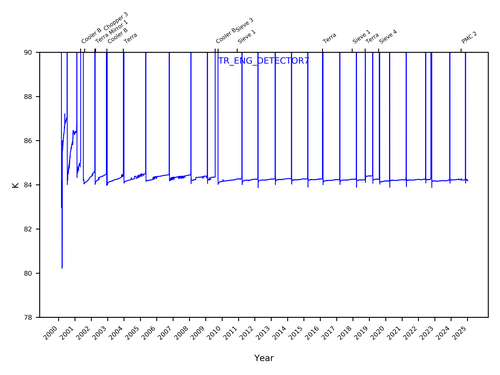
Detector 7 has been holding at a steady temperature of ∼84 K. The vertical lines indicate the decontamination process performed yearly. Between the decontamination cycles, the temperature of the detector increases slightly due to contamination buildup.
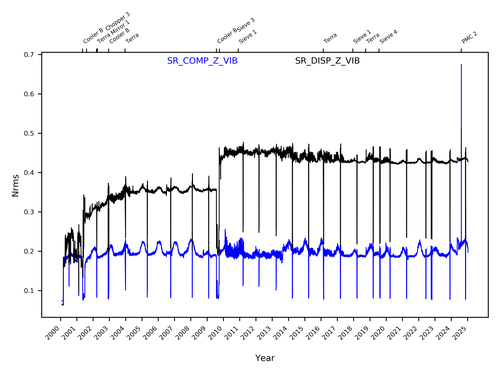
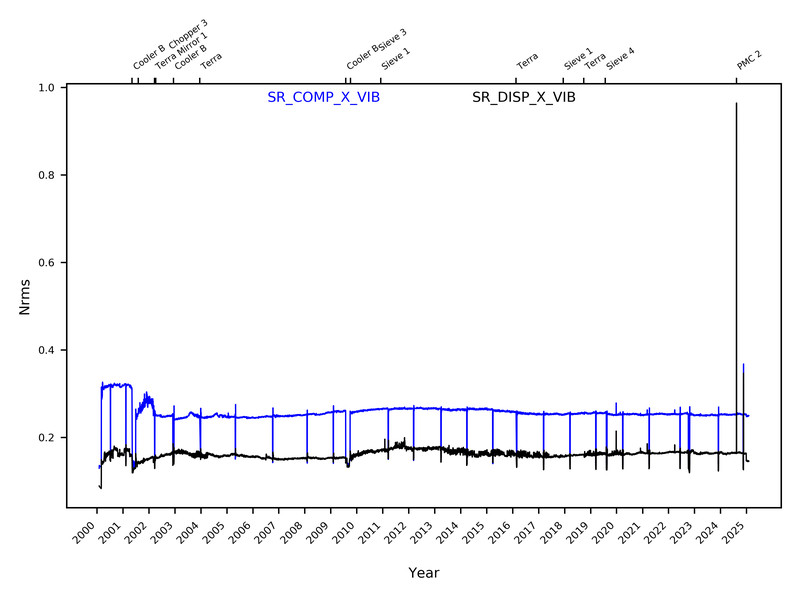
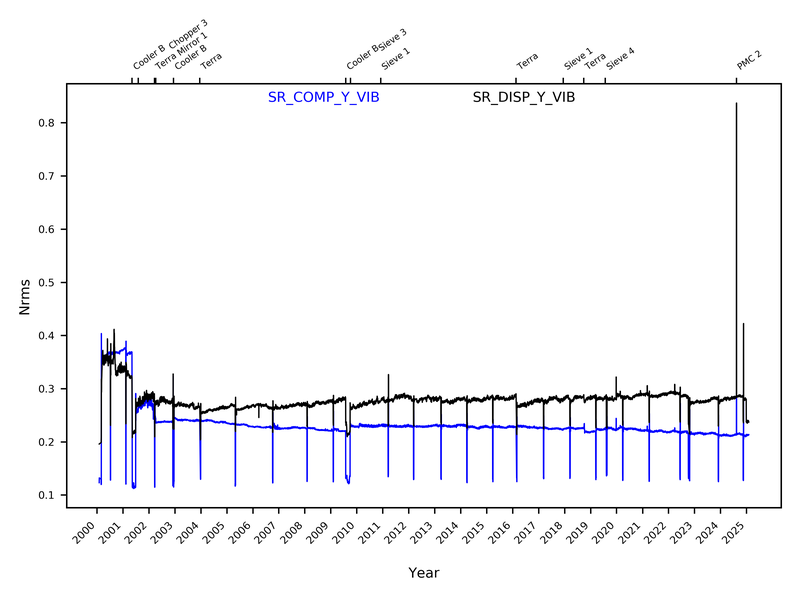
Two accelerometers are used in each of the X, Y and Z axis to measure vibrations. The first cooler anomaly in 2001 caused a slight increase in the axial vibrations for the compressor and a more noticeable increase in the displacer. The 2009 cooler anomaly had an insignificant effect on the axial vibration of the compressor but increased axial vibration in the displacer. The axial vibrations in both the compressor and displacer, follows seasonal variations as well. Despite the anomalies experienced by the coolers, the system vibrations are overall stable.
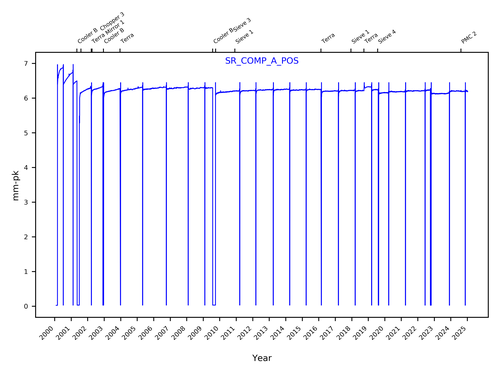
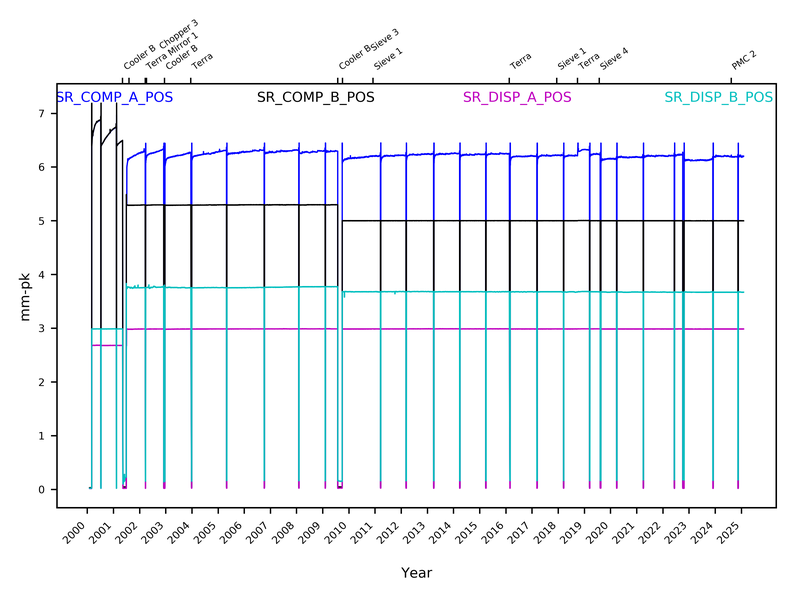
The compressor stroke length for cryocooler A is shown. The vertical lines indicate the decontamination events. Between each decontamination, the compressor stroke increases to compensate for the contamination build-up on the detectors. This increase slows down later in the mission mainly because the contaminants decrease over time. The cooler anomalies are labelled in the figure. The cryocoolers have performed exceptionally well otherwise.
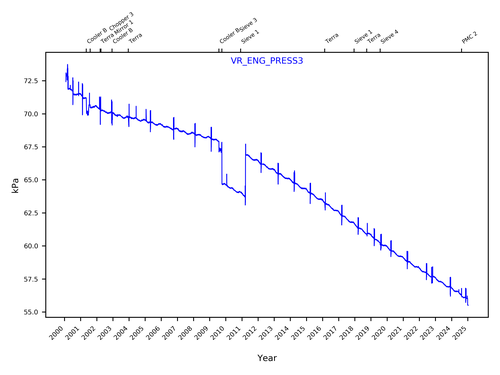
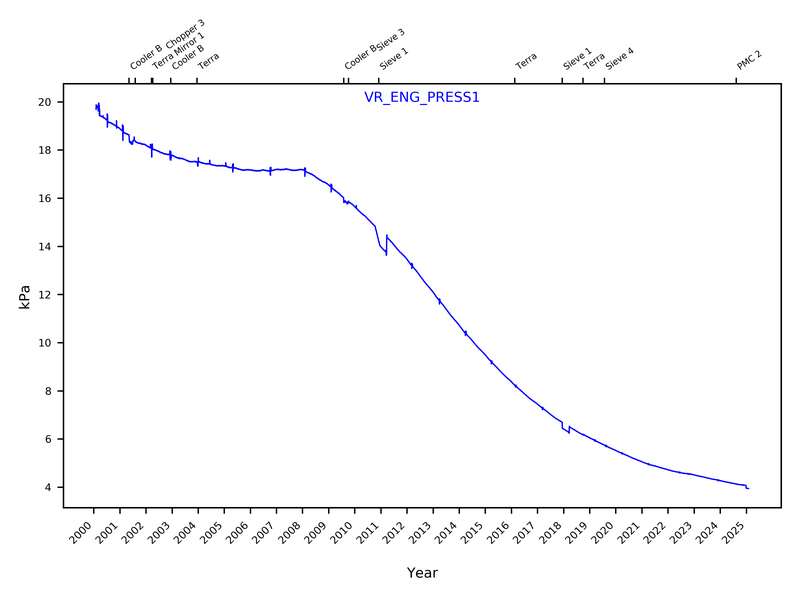
Molecular sieve 3 is connected to LMC 3. Before the cooler anomaly in 2001, the rate of decrease of pressure in LMC 3 was ∼1 kPa per year. After the cooler anomaly until the Sieve 3 anomaly in 2009, the rate of pressure decrease was ∼0.3 kPa per year. After Sieve 3 anomaly was resolved in 2011, the rate of pressure decrease has increased to ∼0.8 kPa per year. Overall, the pressure of LMC 3 has decreased about 27% since launch. This decrease of pressure in the Sieves has been attributed to the aging epoxy in the capillary bonds of the IR window (Andrew S Gibson et al., 2015).

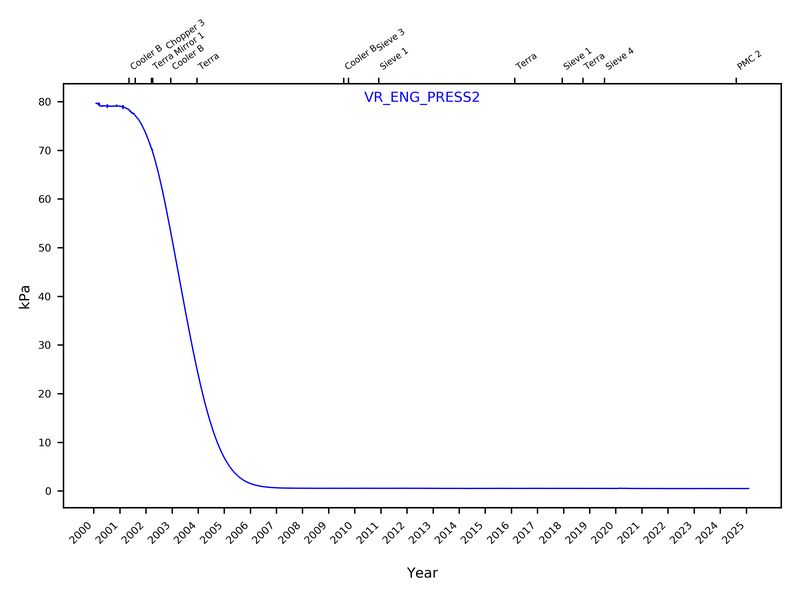
Molecular sieve 4 is connected to PMC 2. The PMCs and their corresponding Sieves have performed nominally throughout the mission until 2019 when Sieve 4 experienced an anomaly. LMC 4 pressure was stable at ∼77 kPa for the first 5 years of the mission and then decreased by ∼0.2 kPa per year until 2010. After that, the pressure rapidly decreased by a rate of ∼2.3 kPa per year to ∼50 kPa in 2020.

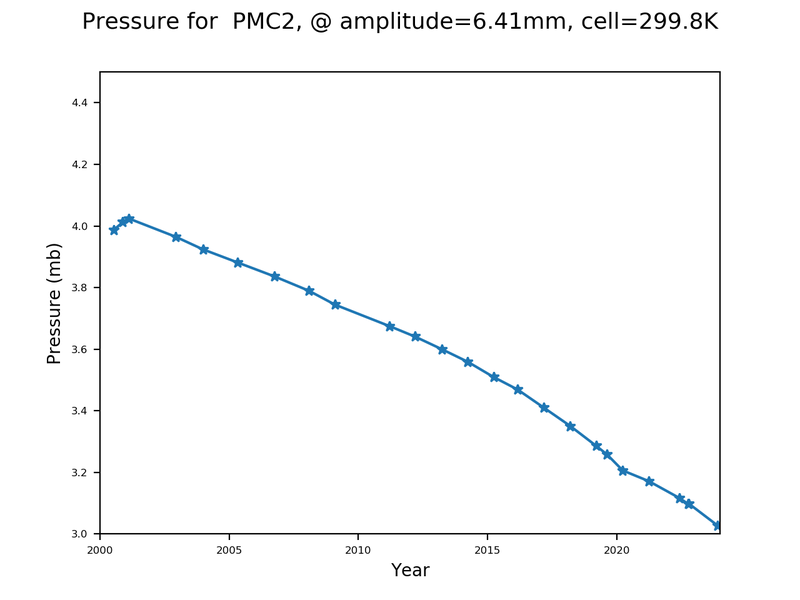
Molecular sieve 4 is connected to PMC 2. The PMCs and their corresponding Sieves have performed nominally throughout the mission until 2019 when Sieve 4 experienced an anomaly, causing a dip in the PMC 2 pressure. Over the course of the mission, there has been a steady decrease in PMC 2 pressure. Due to the low PMC pressures, no sensors were available at time of launch that could measure the pressure within the PMCs. Instead, a functional calibration, termed a "PMC sweep" was developed that could be used to determine the PMC pressure. The PMC sweeps were performed approximately once a year.
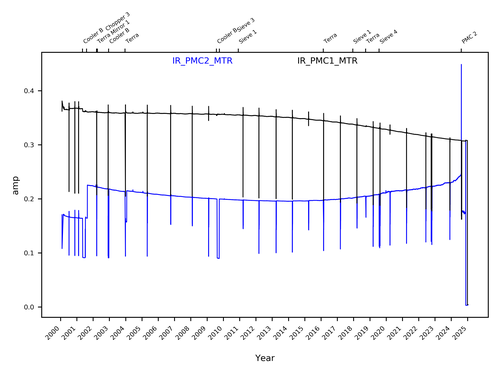
The drive current for PMC 1 motor shows a gradual decrease which is attributed to a slow leaking of the gas in the cell which can cause a resonance shift (Caldwell et al., 2005). PMC 2 motor current followed the same gradual decrease until 2014/2015, when it slowly started to increase. The step change in current observed in 2001 in PMC 2 followed a change in settings after the cooler anomaly in 2001. Following the PMC 2 failure in 2024, PMC 2 was turned off and its current fell to a minimum. In late 2024, PMC 1 was also turned off, along with other elements from Side B of MOPITT, in order to reduce the overall energy consumption of Terra due to satellite power limitations.

The baseplate temperature shows a great deal of thermal stability, with the most prominent variability coming from a slow annual cycle of approximately 0.5 K for thermistor 1, and 0.1 K for thermistors 2 and 3. A sudden decrease in temperature is visible in late 2001, at approximately the same time that Chopper 3 failed. Another drop in temperature occurred in late December 2024, when the Side B elements were turned off in order to reduce the overall energy consumption of Terra due to satellite power limitations.

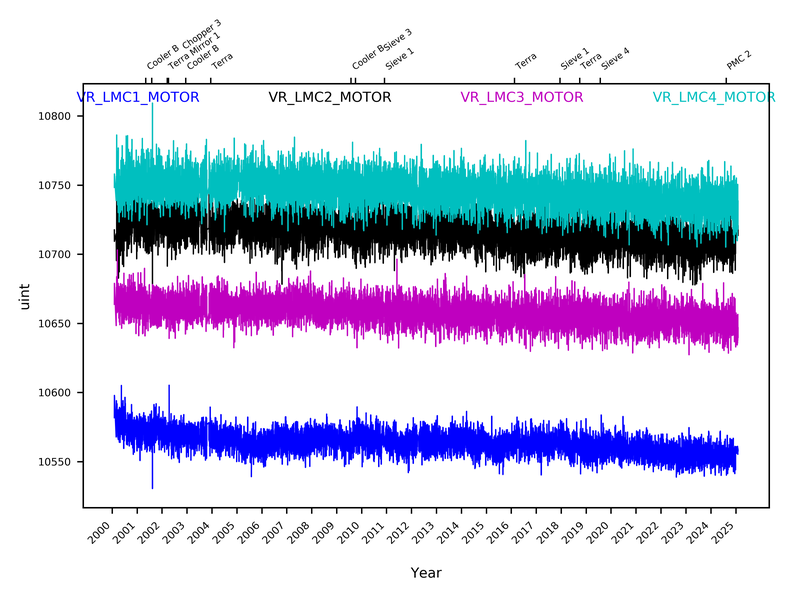
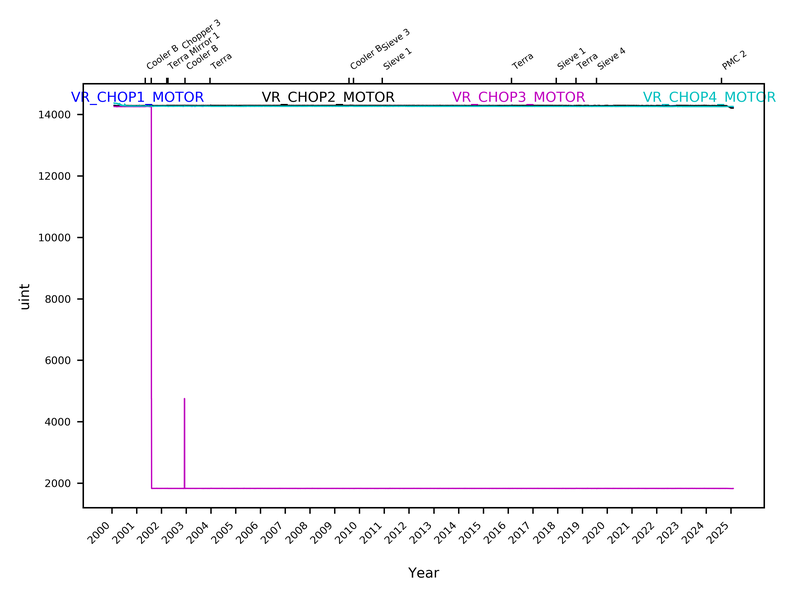
The drive current for the four LMC motors show a significant amount of non-periodic variation; however no trend is observed over the entire mission length. Past the 2009 Cooler anomaly, the motor current for LMC 3 and 4 was found to be more stable than for LMC 1 and 2. A drop in motor current to 0 A is observed for LMC 1 and 2 in late December 2024, when the Side B elements were turned off in order to reduce the overall energy consumption of Terra due to satellite power limitations.

The drive current for the four scan mirrors motors are observed to be consistent throughout the entire MOPITT mission, with exception for Scan Mirror 1, whose failure in 2002 led the motor current to drop to 0 A. The motor current for Scan Mirror 2 also decreased to 0 A near the end of the mission, when the Side B elements were turned off in order to reduce the overall energy consumption of Terra due to satellite power limitations. The vertical lines indicate the hot calibration events.

The drive current for the four Chopper motors show a degree of non-periodic variation; however no significant trend is observed over the mission. Chopper 3 failed in the open position in 2001, hence its motor current dropping to 0 A at this time. The cause for the lower Chopper 4 current, compared to the other working Choppers, is unknown. The motor current for Choppers 1 and 2 decreased to 0 A near the end of the mission, when the Side B elements were turned off in order to reduce the overall energy consumption of Terra due to satellite power limitations.
Detector Temperatures
Detector 1:

Detector 2:

Detector 3:

Detector 4:

Detector 5:

Detector 6:

Detector 7:

Detector 8:

Instrument Vibrations
X-axis vibrations:
Y-axis vibrations:
Z-axis vibrations:

Sieve-related telemetry
Sieve 1 pressure:
Sieve 2 pressure:
Sieve 3 pressure:

Sieve 4 pressure:

Sieve temperature:

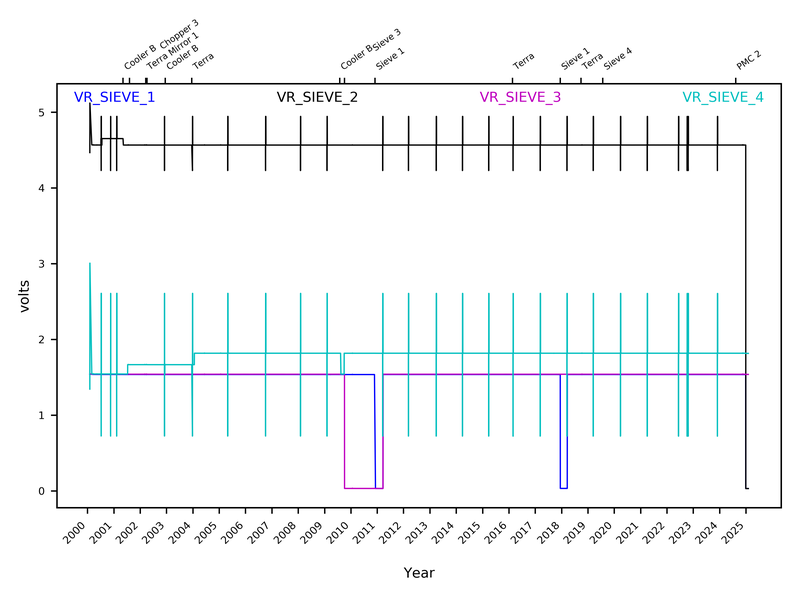
Sieve voltage:
PMC-related Telemetry
PMC 2 pressure:
PMC position:

PMC 1 position error:

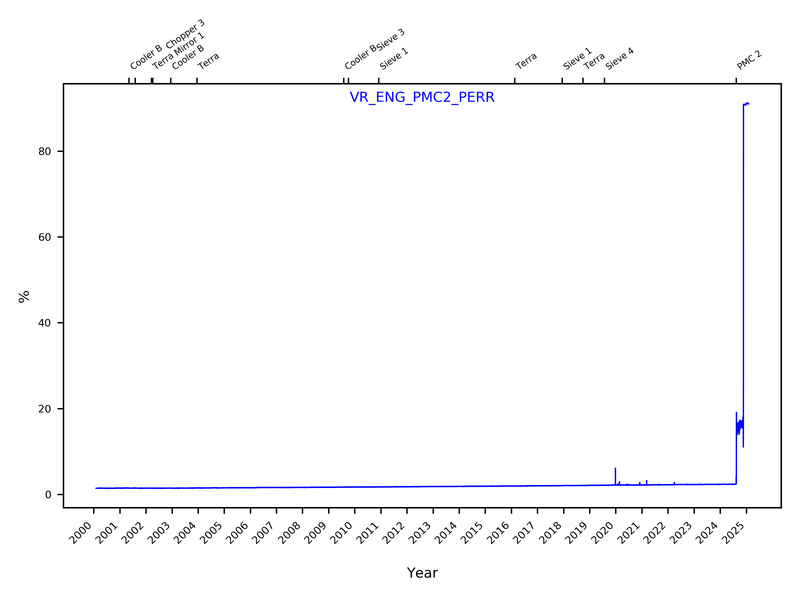
PMC 2 position error:
PMC temperature:

PMC motor temperature:

PMC motor current:

PMC 1 motor voltage (uncalibrated):

PMC 2 motor voltage (uncalibrated):

LMC-related telemetry
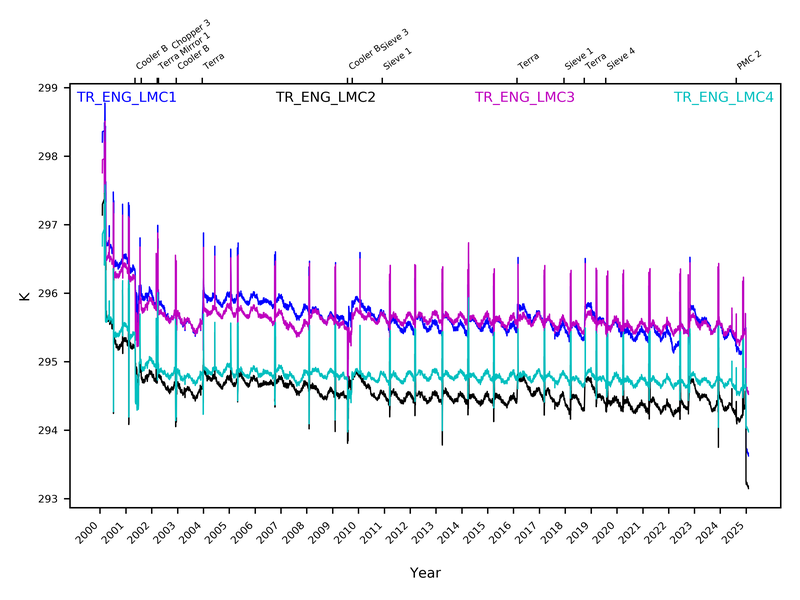
LMC temperature:
LMC motor temperature:

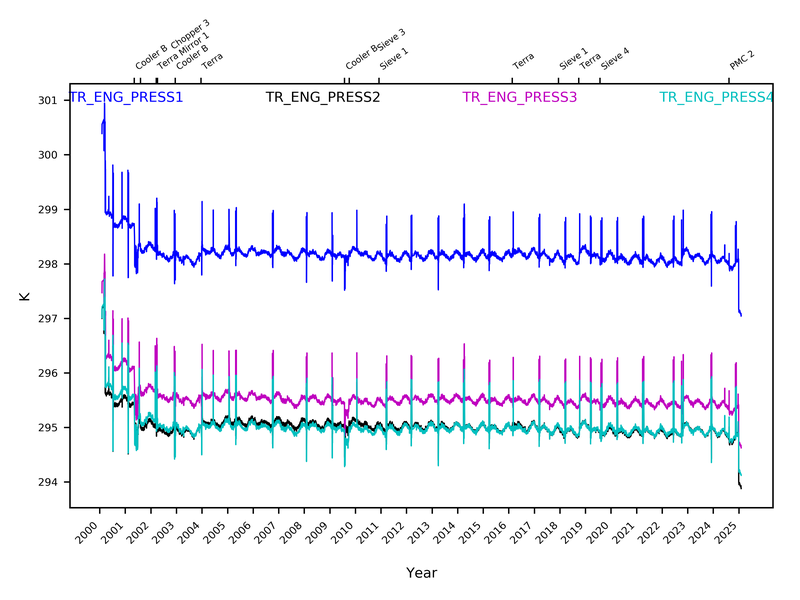
LMC pressure thermistor temperatures:
LMC motor current:

LMC motor voltage (uncalibrated):
Chopper-related telemetry
Chopper temperature:

Chopper motor current:

Chopper motor voltage (uncalibrated):
Chopper motor temperature:

Cooler-related telemetry
Compressor/displacer position:
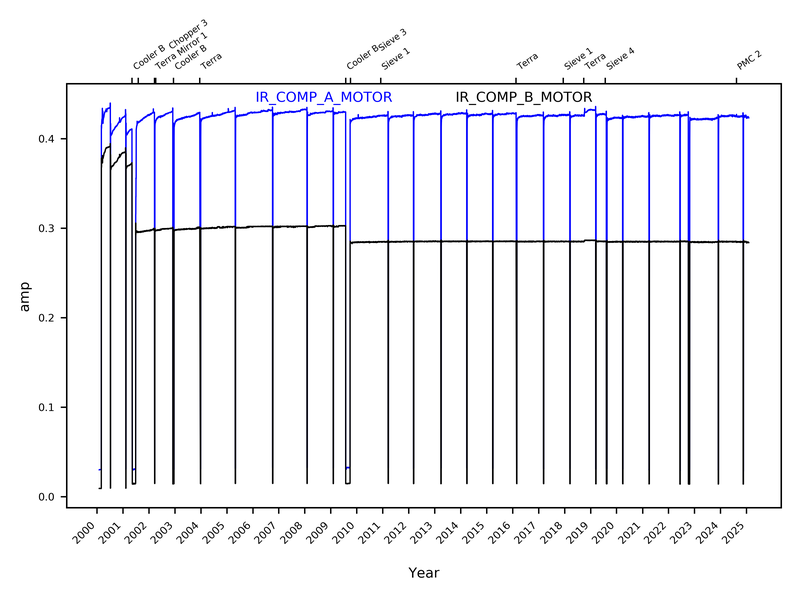
Compressor motor current:
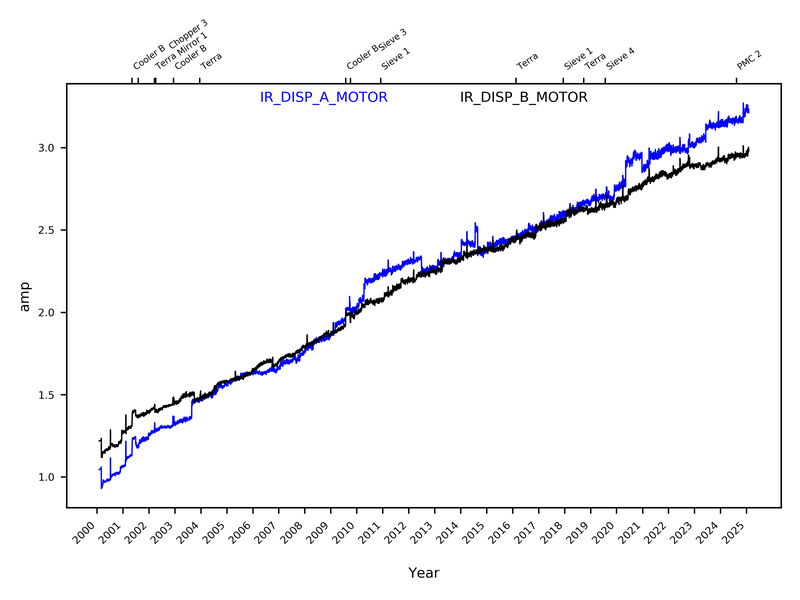
Displacer motor current:
Compressor/displacer driver temperature:

Scan mirror-related telemetry
Scan mirror motor temperature:

Scan mirror motor current:

Scan mirror motor voltage:

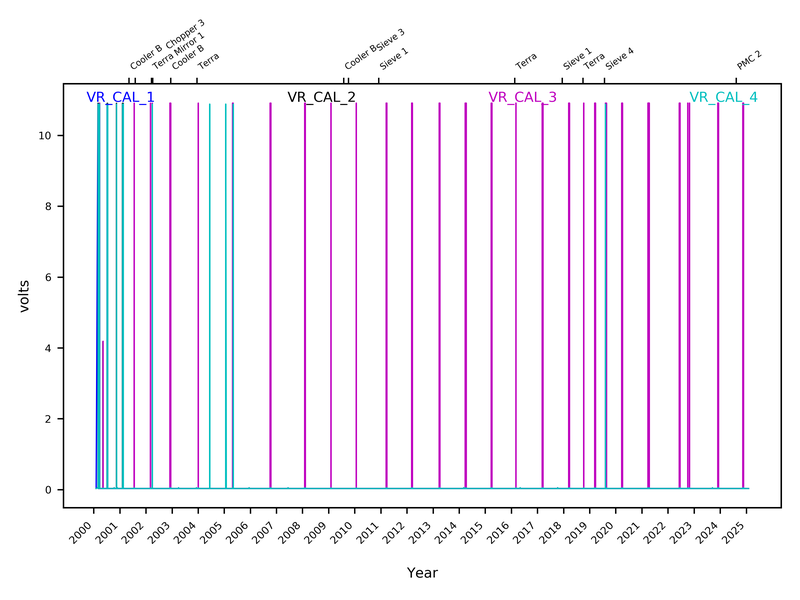
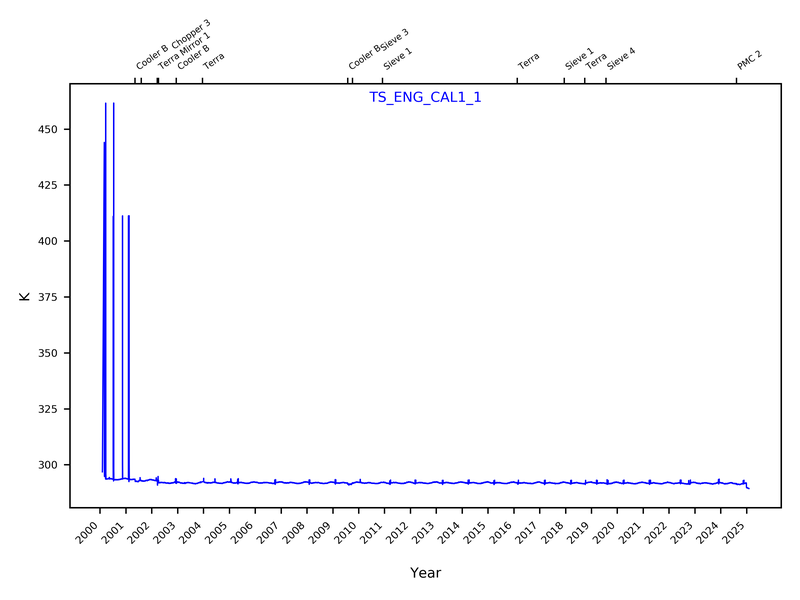
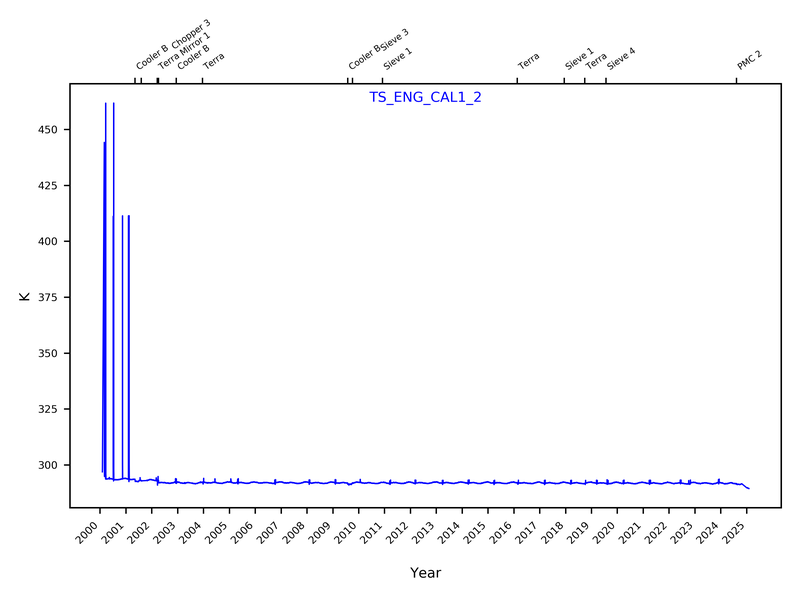
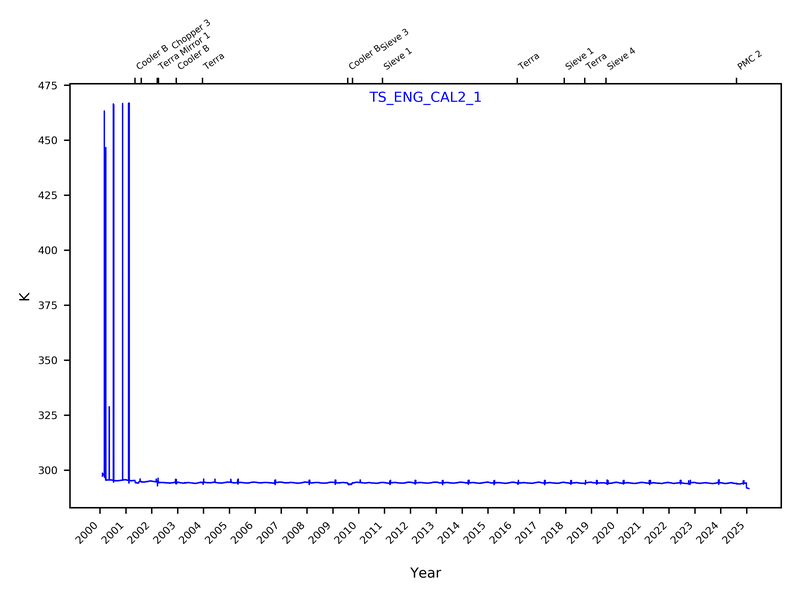
Calibration sources
Calibration source voltage:
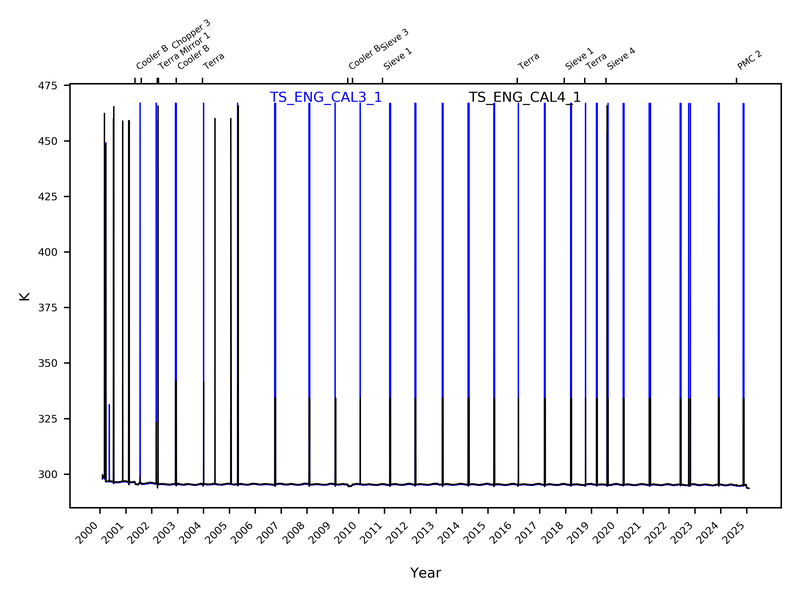
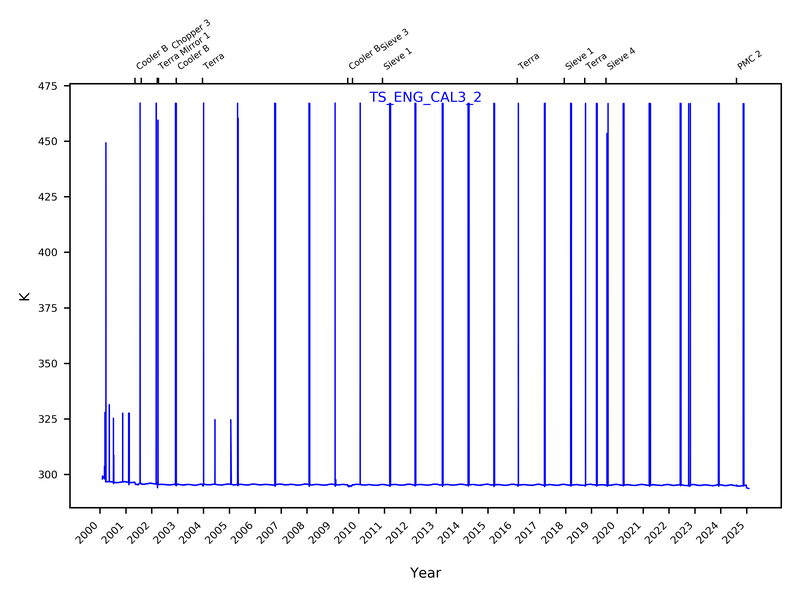
Calibration source 1, thermistor 1 temperature:
Calibration source 1, thermistor 2 temperature:
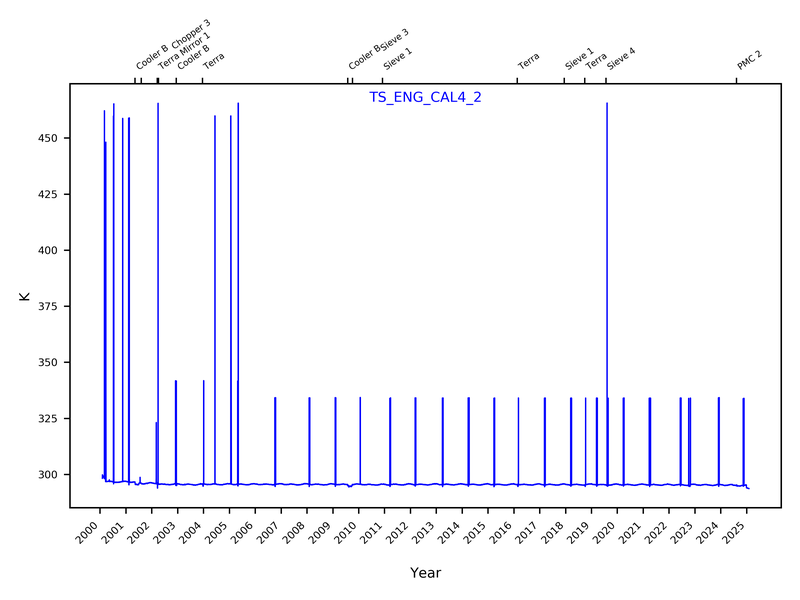
Calibration source 2, thermistor 1 temperature:
Calibration source 2, thermistor 2 temperature:

Calibration source 3 and 4, thermistor 1 temperature:
Calibration source 3, thermistor 2 temperature:
Calibration source 4, thermistor 2 temperature:
Heater nest
Heater nest voltage:

Thermal environment
Baseplate temperature:

Optical table 1 temperature:

Optical table 2 temperature:

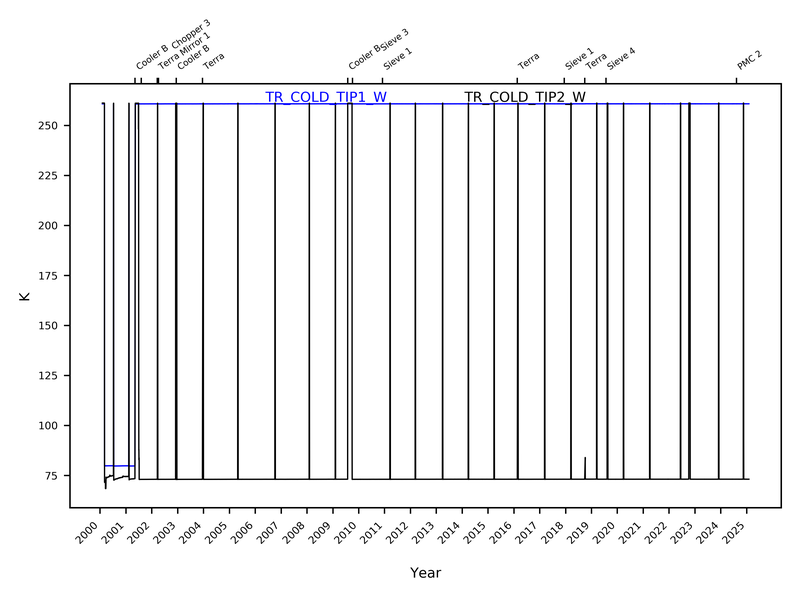
Cold tip wide temperature:
Cold tip narrow temperature:

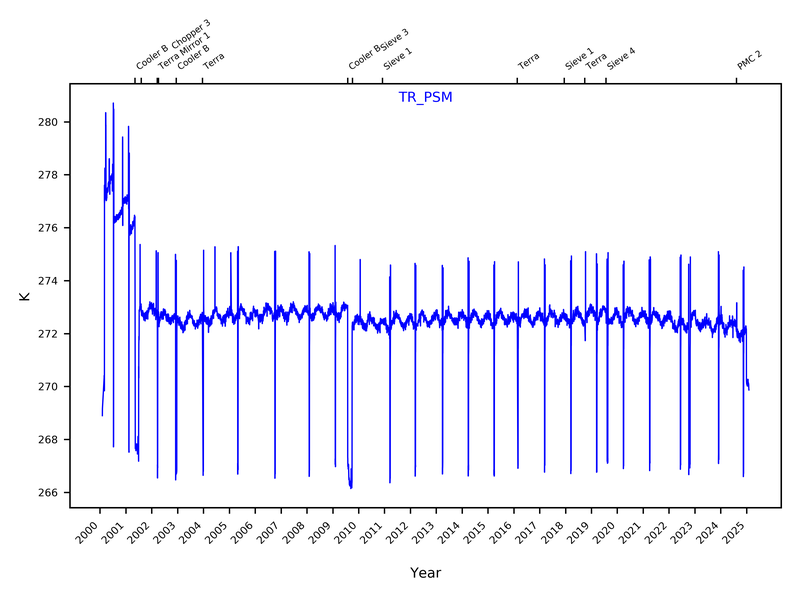
Power supply module temperature:
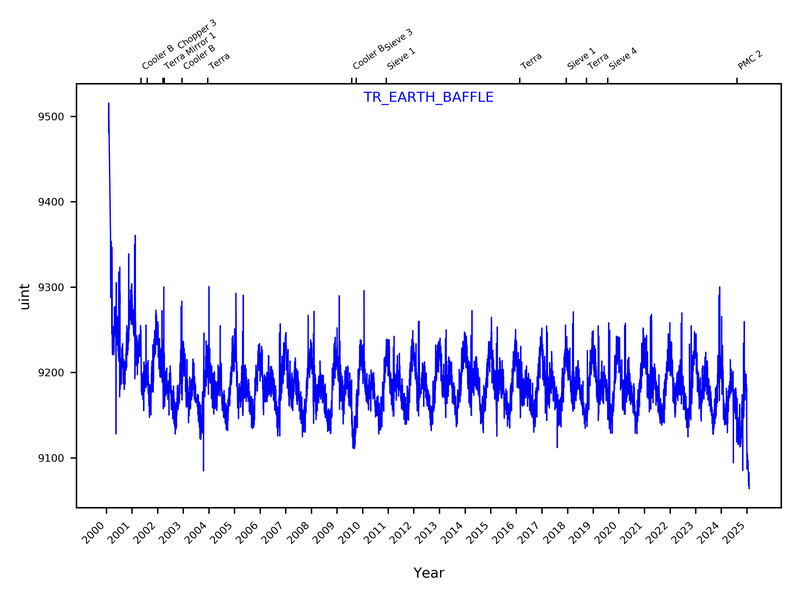
Earth port baffle temperature:
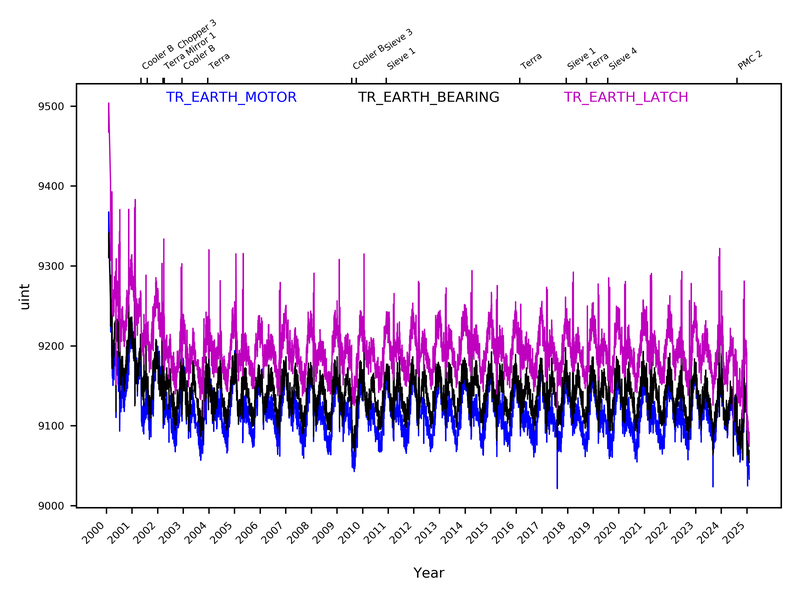
Earth port motor, bearing, and latch temperature:
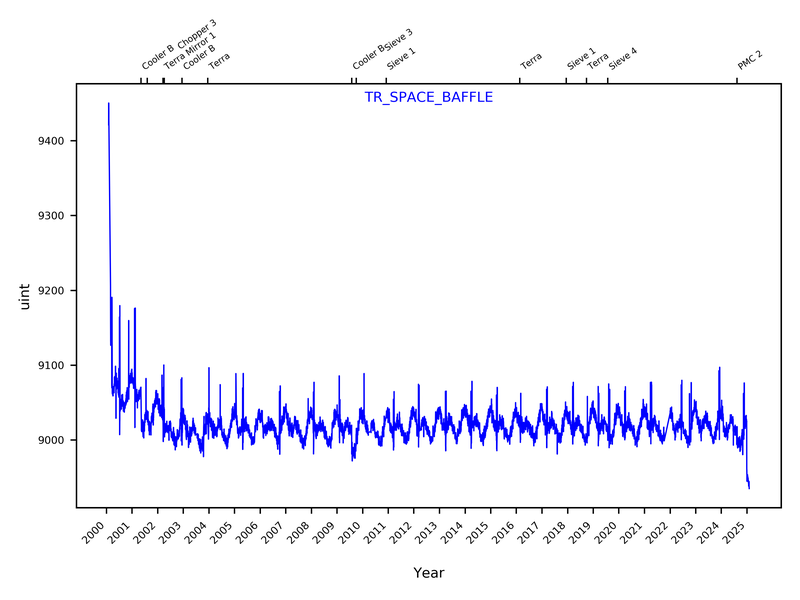
Space port baffle temperature:
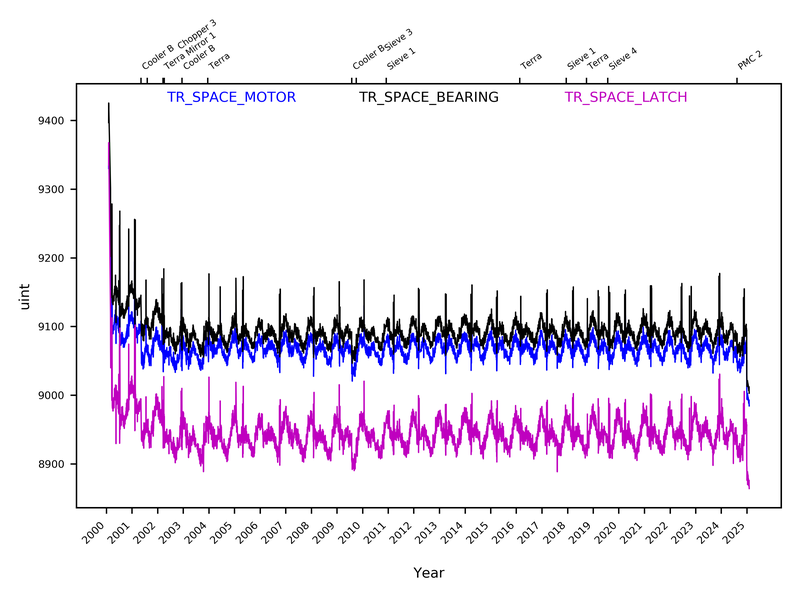
Space port motor, bearing, and latch temperature:
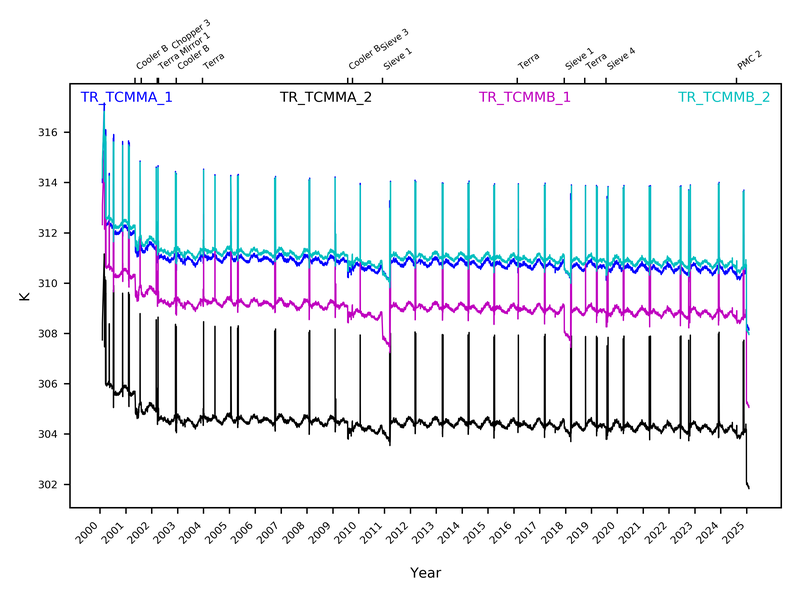
Thermal control and monitoring module temperature:
Voltage monitors
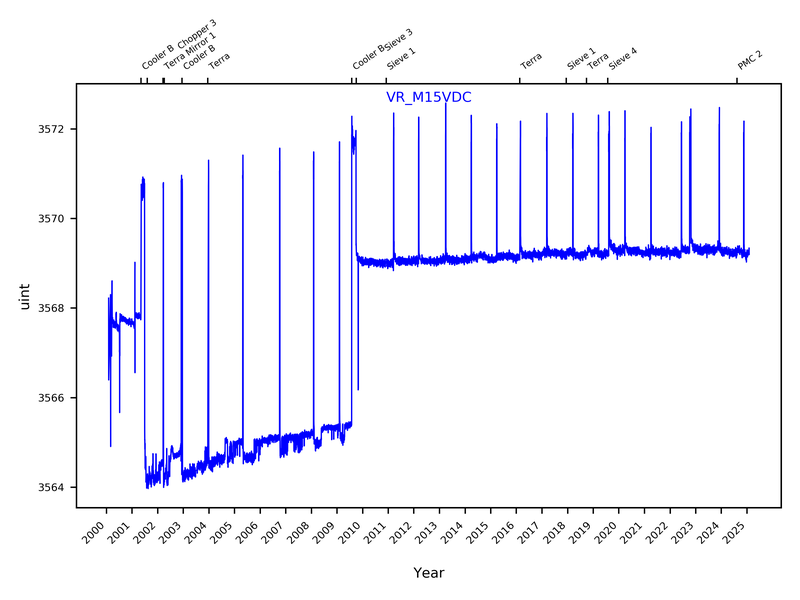
12 volt monitor:

15 volt monitor: