20-year record of MOPITT CO observations
As we're currently in the third decade of MOPITT operations, trend analyses are expected to soon incorporate the 20+ years of MOPITT CO data. As of now, no publications have been put forth for this entire period, but new results are expected soon.
A 15-year record of CO emissions
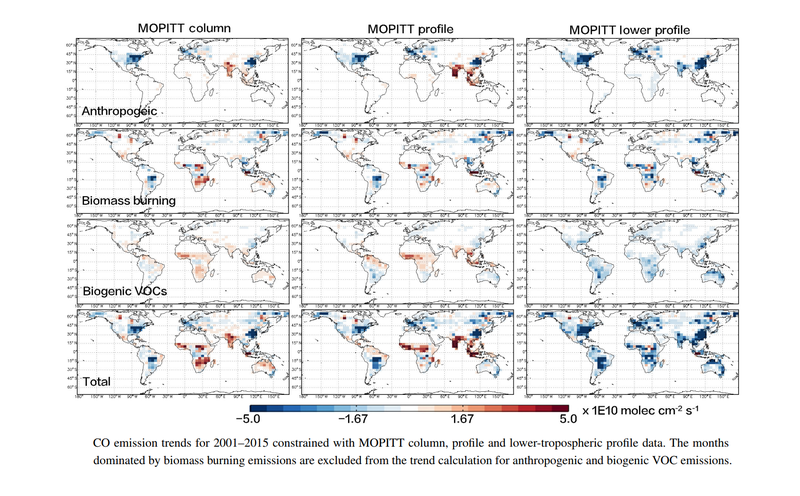
A 15-year record of CO emissions constrained by MOPITT CO observations was performed by Jiang et. al. (Jiang et. al., 2017) . In this work, the monthly inversions for the period of 2001–2015, using MOPITT column, profile and lower tropospheric profile data was performed to investigate the influences associated with vertical sensitivity of satellite instrument and model transport error. The figure below shows the CO emission trends for 2001–2015 constrained by these different data sets. The various spatial and temporal distribution of emissions sources (e.g., anthropogenic vs. biomass burning) provides valuable information with which to distinguish the contribution from each category. For anthropogenic sources, all three analyses show significant emission reduction from North America, Europe and China. The emission estimates constrained with MOPITT column and profile data suggest increasing CO emissions from India and southeast Asia. Conversely, the emission estimate constrained with MOPITT lower-tropospheric profile data shows a decreasing trend in this region. For biomass burning sources, a negative trend over boreal North America, boreal Asia and South America was found, and a positive trend over Indonesia was found that is primarily due to the strong impacts of El Niño in 2006 and 2015 on biomass burning in this region. The results for biogenic VOCs are inconclusive; the emission estimates constrained with MOPITT column and profile data show moderate positive trends in the tropics and slight negative trends in mid-latitude regions, whereas the emission estimate constrained with MOPITT lower-tropospheric profile data shows a negative trend globally.
Decadal record of satellite CO observations
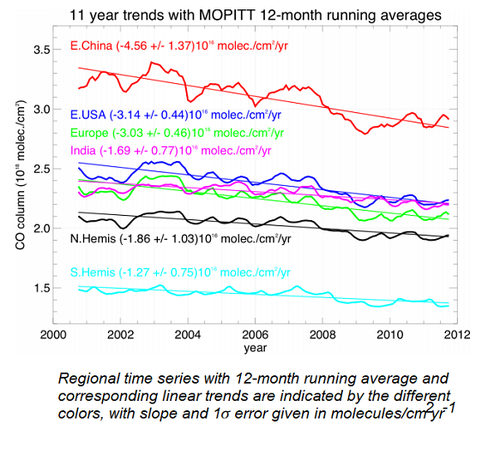
A study done by Worden et. al. (Worden et.al., 2013) shows CO trends as measured by MOPITT for 2001 to 2012. A 12-month running average which removes seasonal variations in CO shows decreasing trends for different regions in different colors. the highest slope is observed for eastern China [30 °- 40 ° N, 110 °- 123 ° E] in red and the lowest slope is observed for the southern hemisphere [0 ° - 60 ° S] in neon blue. The dark blue line shows CO trend for Eastern USA [35 ° - 40 ° N, -95 ° - -75 ° E] with a slope of -3.14 x 10E16 (molecules/cm2/yr) and a standard error of +/- 0.44 x 10E16 (molecules/cm2/yr).
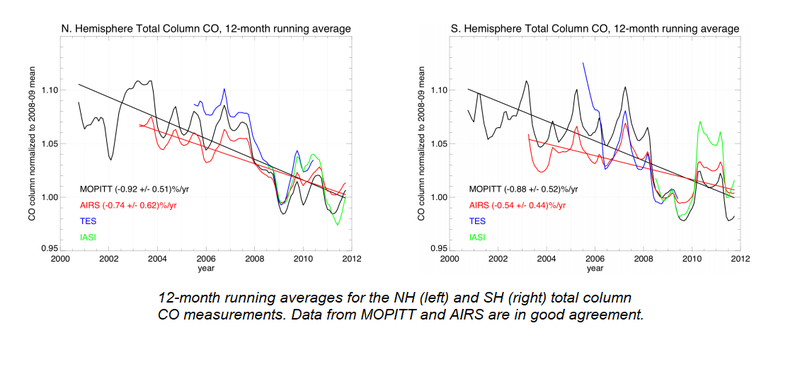
A comprehensive record of satellite observations of total column CO from 2000 to 2011 using available measurements from nadir-viewing thermal infrared instruments is presented in this study as well. The four instruments used are MOPITT aboard Terra, AIRS aboard Aqua, TES aboard Aura and IASI aboard MetOp-A. The figure below shows MOPITT, AIRS, TES and IASI 12-month running average time series normalized by 8/2008–7/2009 average CO columns for the northern hemisphere (NH) and southern hemisphere (SH), respectively, along with linear trends over the MOPITT and AIRS data records. This data shows a remarkable agreement between MOPITT, AIRS, TES and IASI observations. The MOPITT data shows a sharper decreasing trend than the AIRS data records.
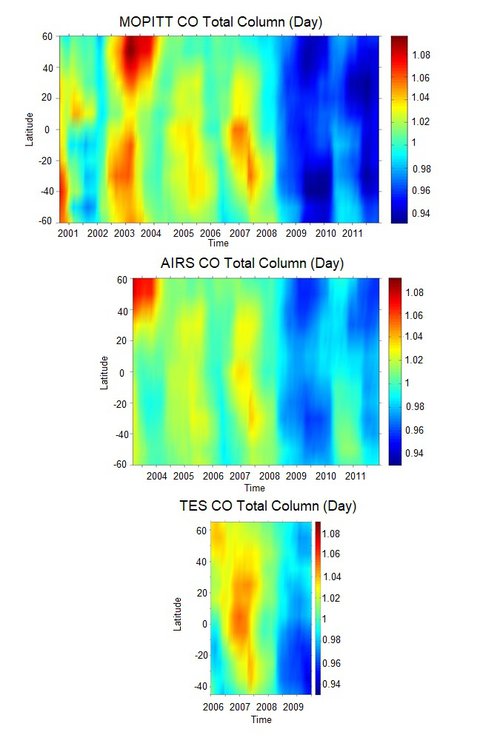
All instruments show a deep decrease in CO measurements in 2009. These variations relative to the zonal average, are almost of the same magnitude at all latitudinal bands. The opposite figure shows the color plot of the ratio of seasonal removed CO total Column, to the CO total Column -Latitudinal Average for MOPITT, AIRS and TES.
References
Jiang, Z., J. R. Worden, H. Worden, M. Deeter, D. B. A. Jones, A. F. Arellano, and D. K. Henze (2017), A 15-year record of CO emissions constrained by MOPITT CO observations, Atmos. Chem. Phys., 17(7), 45654583, doi:10.5194/acp-17-4565-2017.
Worden, H. M., M. N. Deeter, C. Frankenberg, M. George, F. Nichitiu, J. Worden, I. Aben, K. W. Bowman, C. Clerbaux, P. F. Coheur, A. T. J. de Laat, R. Detweiler, J. R. Drummond, D. P. Edwards, J. C. Gille, D. Hurtmans, M. Luo, S. Martínez-Alonso, S. Massie, G. Pfister, and J. X. Warner (2013b), Decadal record of satellite carbon monoxide observations, Atmos. Chem. Phys., 13(2), 837850, doi:10.5194/acp-13-837-2013.